Float Boston · 30-Day Experiment
I floated every day
for 30 days.
Here's what happened.
We all know floating is good for you — but how good? Float Boston owner Mark floated every day for 30 days and measured everything. Here's what the science actually showed.
The experiment
What I was measuring and why
Hey everyone, my name is Mark and I run Float Boston. I floated every day for 30 days and tracked everything — Oura ring data, blood draws, and daily journal entries as social proof of what floating can or cannot do. Real data. No fluff. Here's what actually happened.
Before the experiment started I was carrying elevated inflammation, an erratic HRV, and inconsistent sleep scores. I had barely floated since December. This wasn't a controlled lab study. It was a real person, running a business, trying to see what consistent floating actually does when life doesn't slow down to accommodate it.
Weeks 1–2
Sedentary baseline
Working 40–45 hours a week in-shop. Mostly stationary. Average active calorie burn around 490/day. This was as close to a controlled baseline as I could get.
Week 3
The Seattle disruption
Flew to Seattle. Walked 8+ miles a day, drank more than usual, suffered jet lag, took a red-eye home, then dismantled a float tank solo the next day. A deliberate stress test on the experiment.
Week 4
The recovery
Returned to Somerville. Work hours jumped from 40 to 80/week. Physically wrecked from the travel. This week answered the question: how fast does floating help you bounce back?
The data
Before & after — 30 days of daily floating
Oura ring — 30-day averages
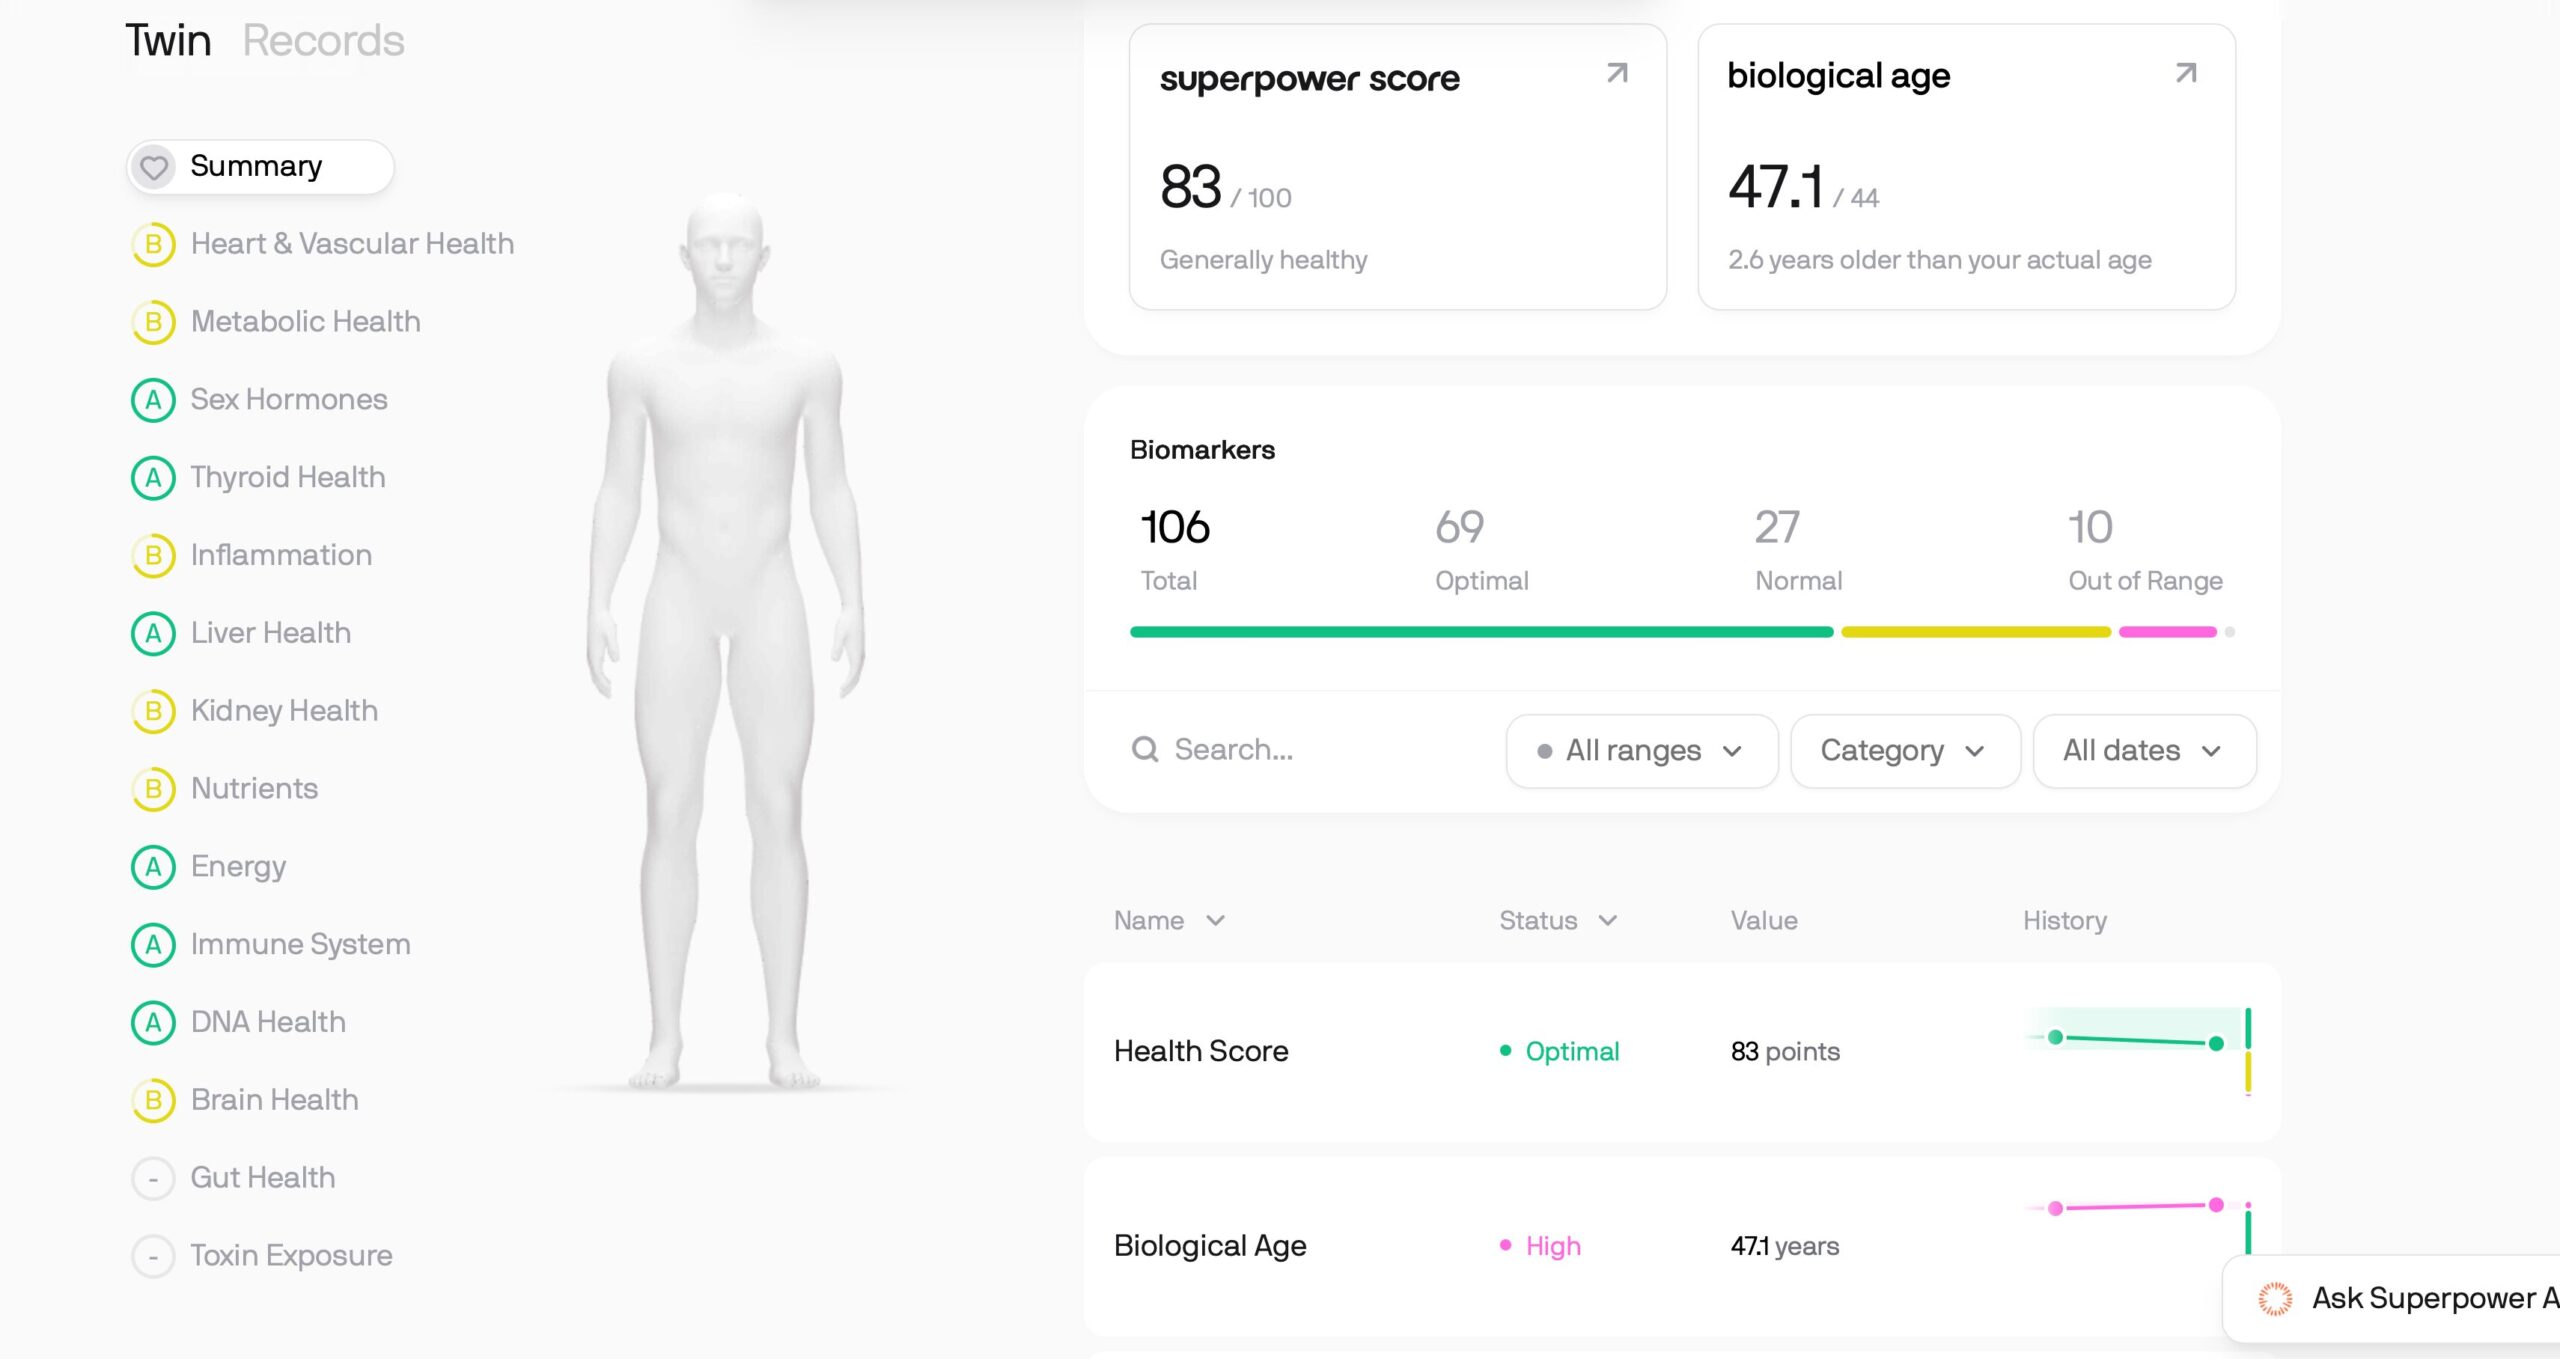
Superpower post-challenge dashboard — 83/100, 69 optimal markers, 10 out of range
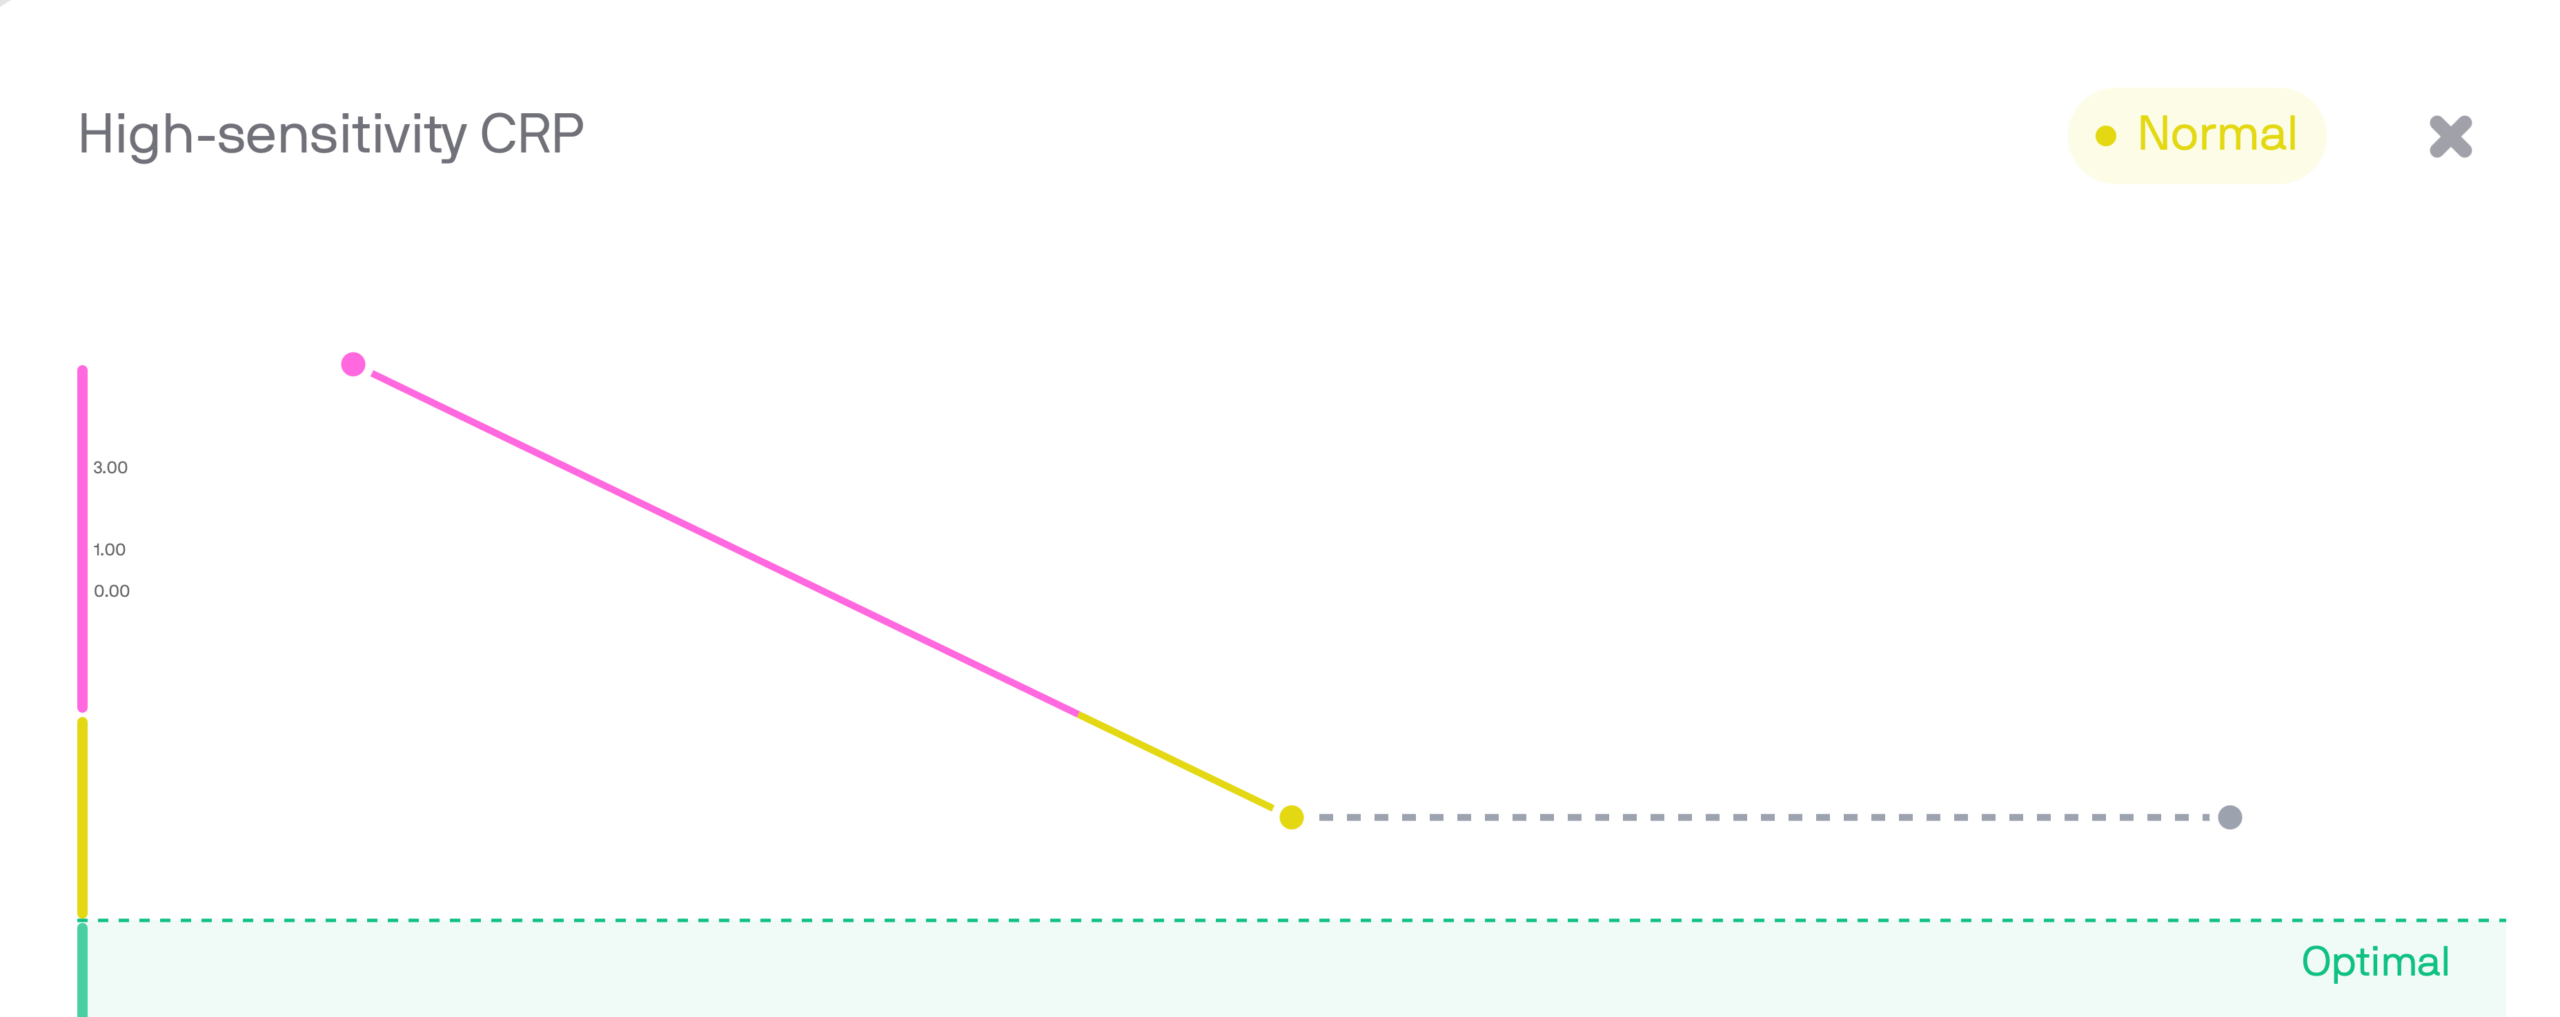
hs-CRP (inflammation) — 6.4 → 2.0 mg/L. The steepest line on the chart.
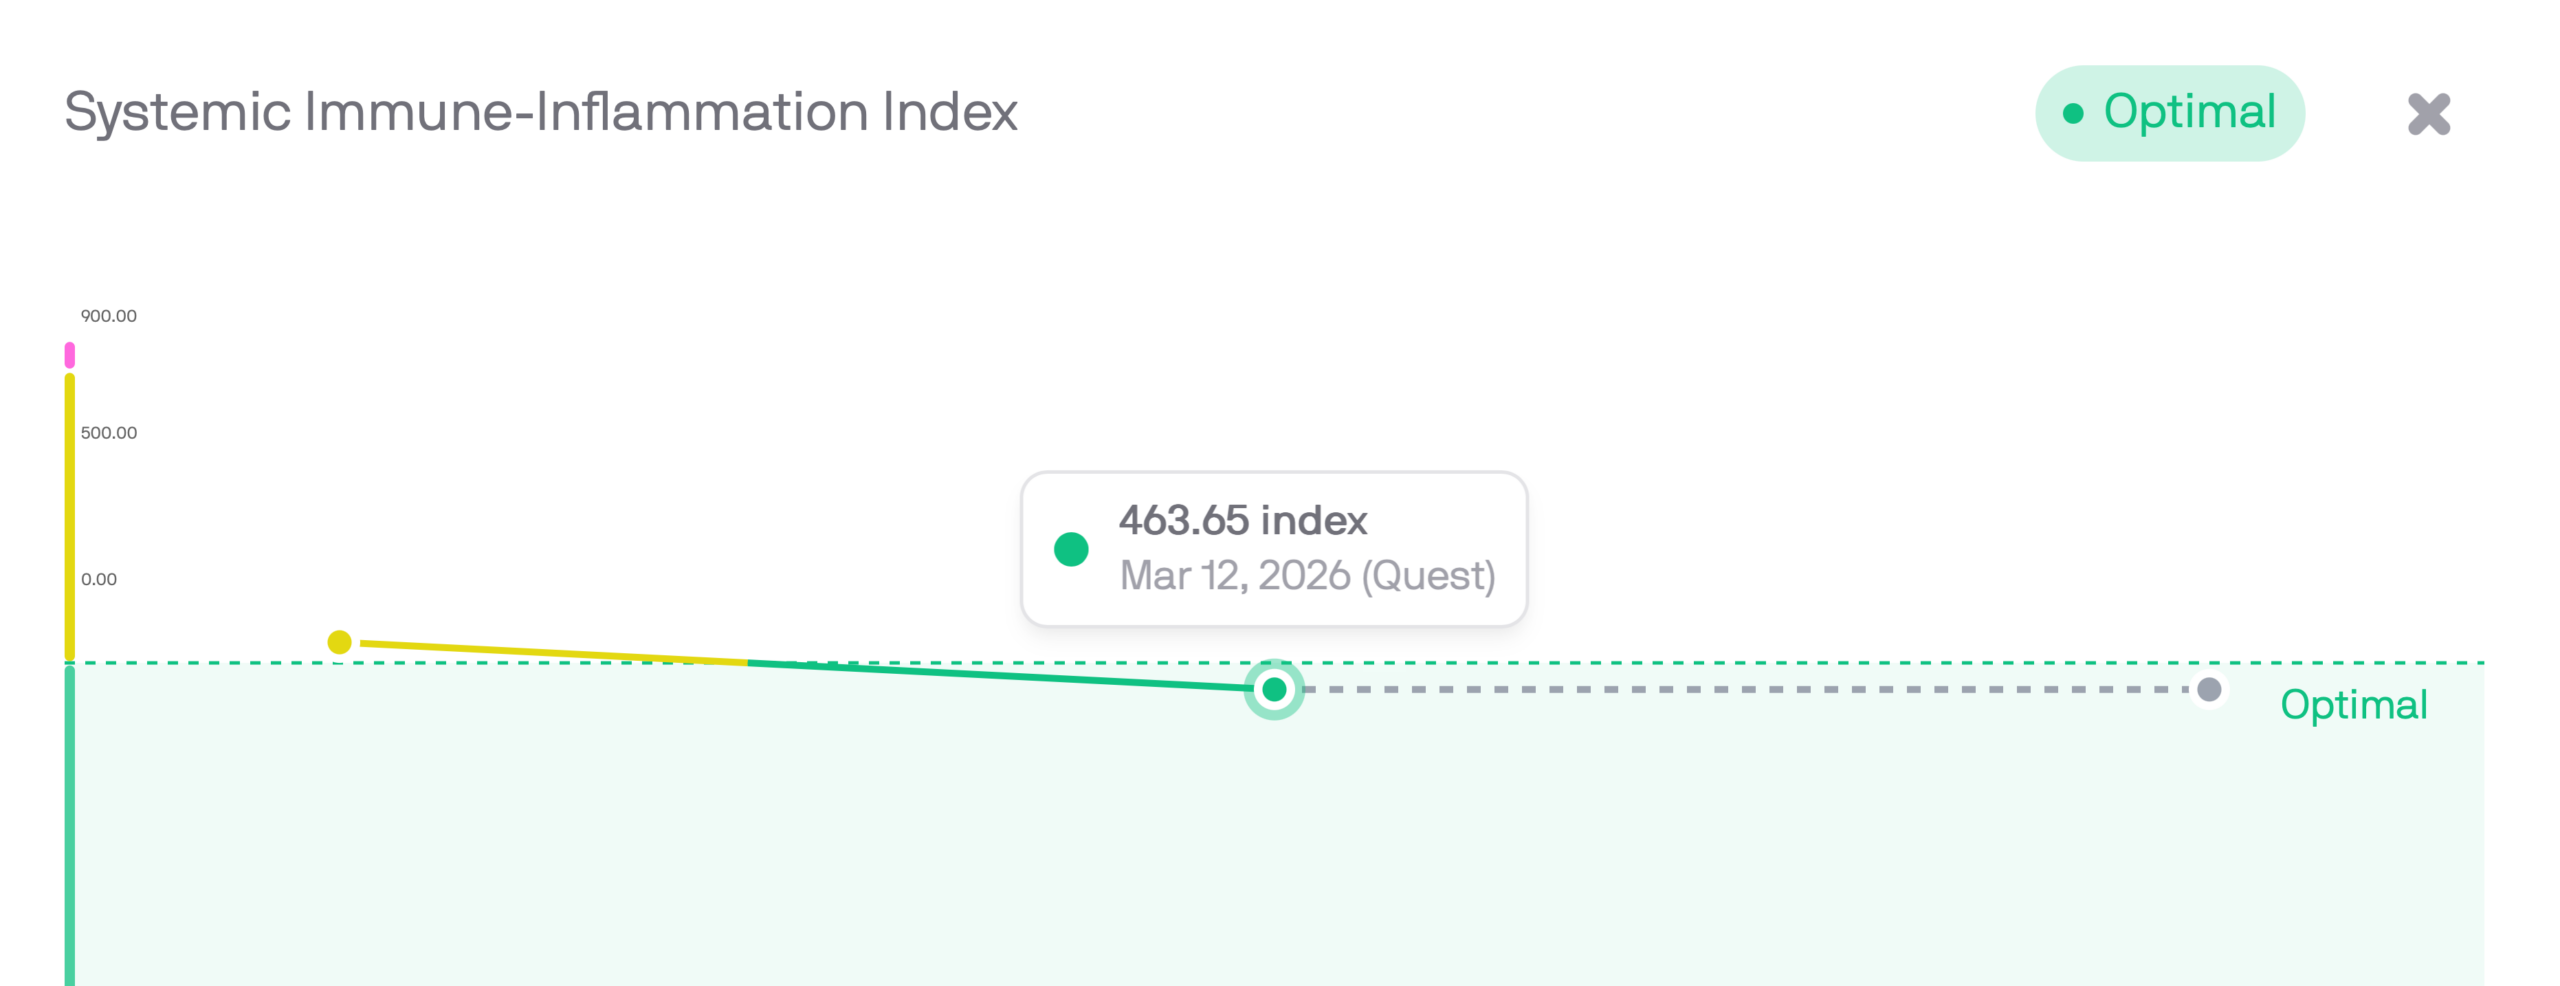
Systemic Immune-Inflammation Index — into optimal range by end of challenge
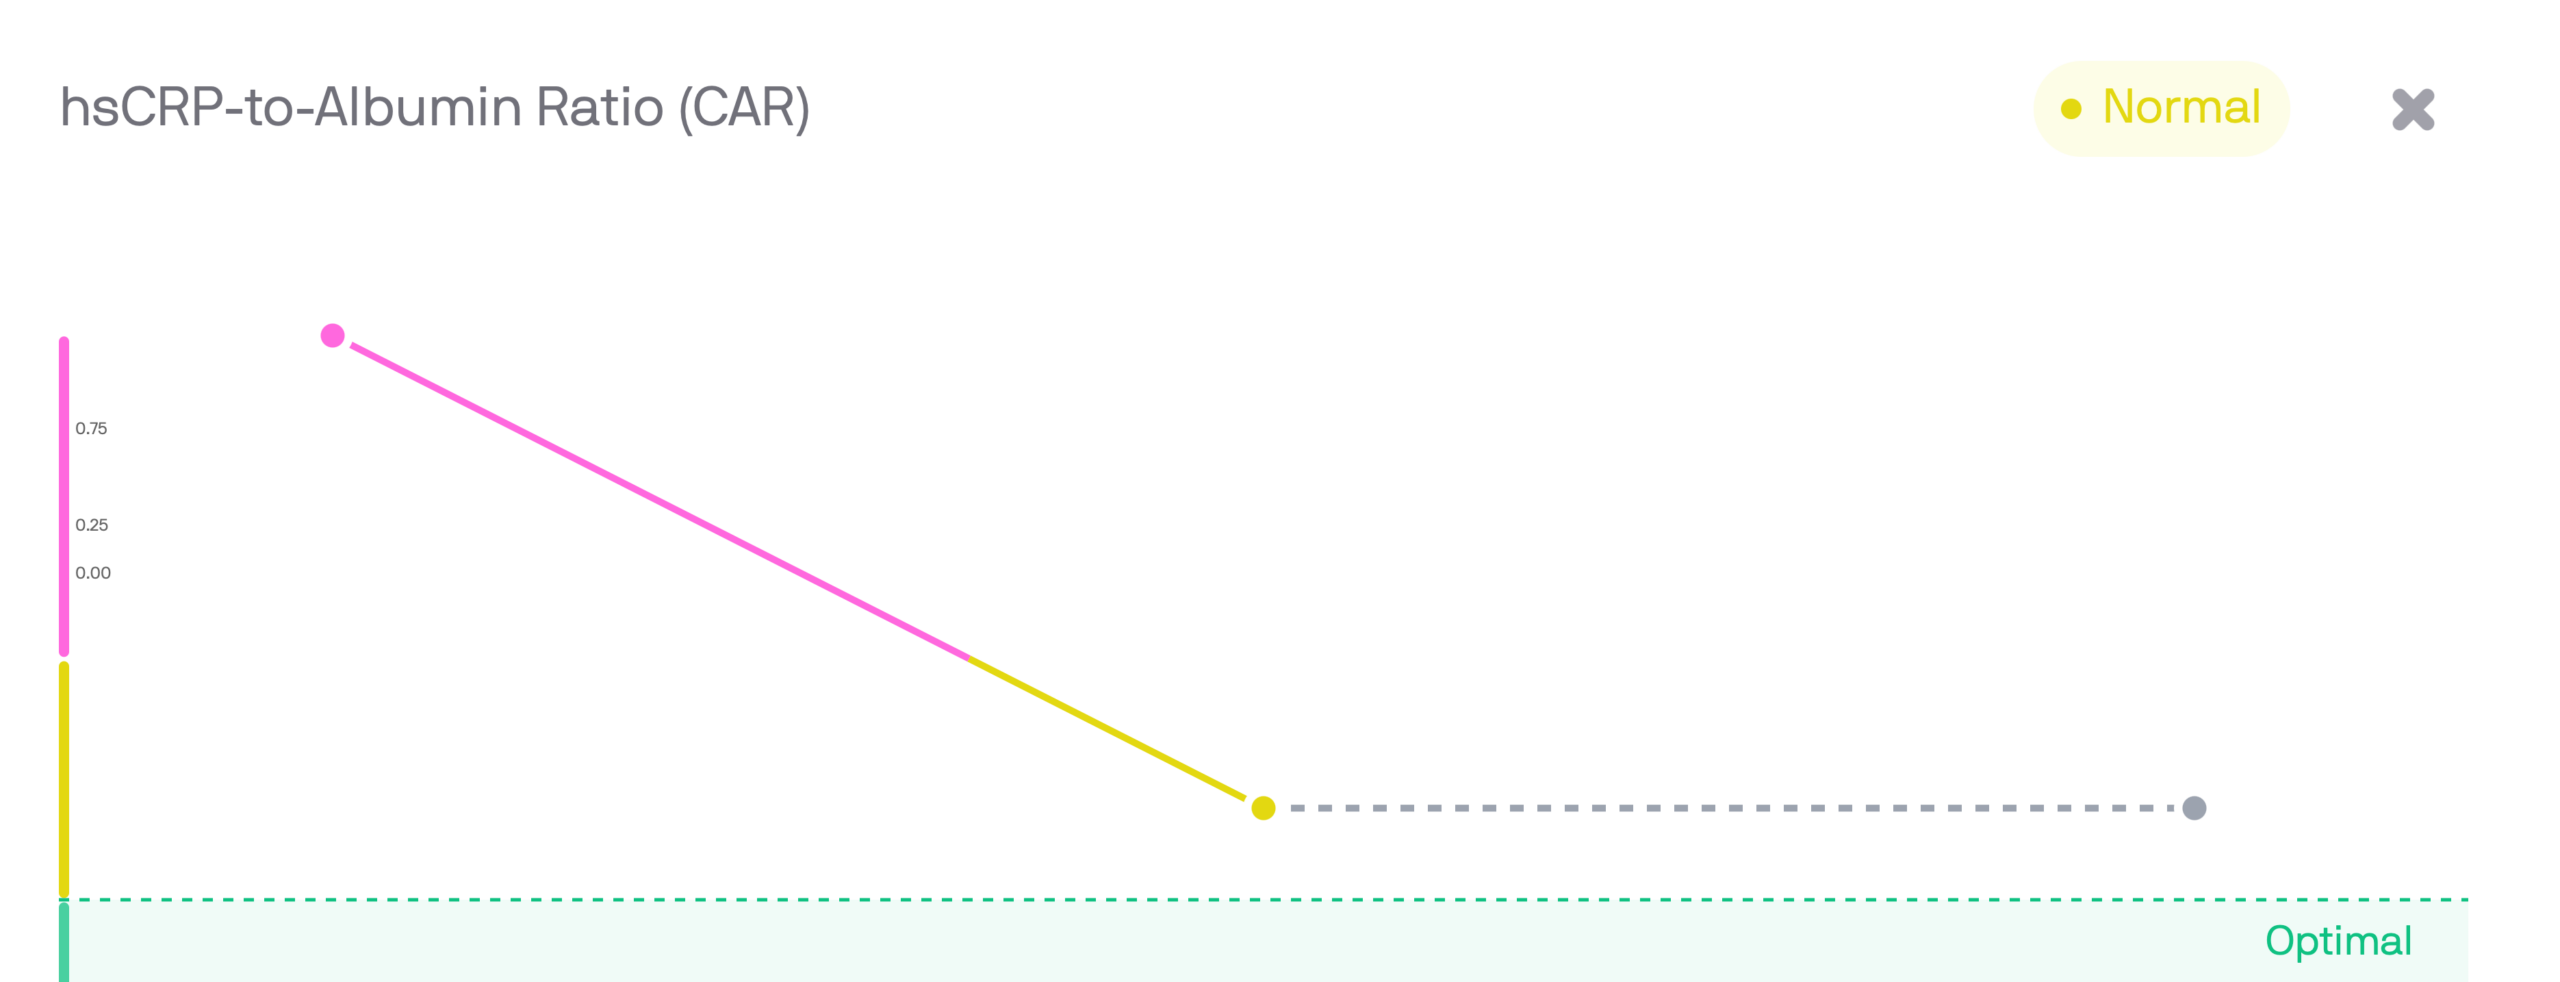
hsCRP-to-Albumin Ratio (CAR) — significant drop toward optimal range
Blood draw comparison — Quest Diagnostics
Draw 1: Feb 9, 2026 · Draw 2: Mar 12, 2026
| Marker | Before | After | Context |
|---|---|---|---|
| Inflammation | |||
| hs-CRP (inflammation) | 6.4 mg/L | 2.0 mg/L | 69% reduction. Optimal is <1.0. Went from higher-risk to average range. |
| Stress & hormones | |||
| Cortisol | 10.3 mcg/dL | 17.2 mcg/dL | Both within normal range. Draw 1 was afternoon; draw 2 was early morning — morning cortisol is naturally higher. |
| DHEA Sulfate | 146 mcg/dL | 186 mcg/dL | Increased. Both within range. DHEA supports stress resilience and energy. |
| Testosterone (total) | 387 ng/dL | 475 ng/dL | Notable increase, both within range. Reduced chronic stress may play a role. |
| Cardiovascular — the ratios matter more than total numbers | |||
| Total cholesterol | 207 mg/dL | 227 mg/dL | HDL improved significantly which changes the picture — see the ratios below. |
| HDL (good cholesterol) | 60 mg/dL | 71 mg/dL | Strong improvement. Higher HDL is protective. This moved the ratios in a better direction. |
| LDL cholesterol | 132 mg/dL | 139 mg/dL | Slightly up but context matters — see the ratios below. |
| Chol/HDL ratio | 3.5 | 3.2 | Improved. This is the ratio that matters most for cardiovascular risk. |
| LDL/HDL ratio | 2.2 | 2.0 | Improved. Below-average risk range is <2.28. Now well within that. |
| Overall scores (Superpower) | |||
| Biological age | 44.9 | 47.1 | Ticked up during the Seattle disruption week — elevated activity, alcohol, poor sleep, and jet lag all affect this score. Not a floating result. |
| Superpower score | 86 | 83 | Same explanation. The lifestyle disruption in week 3 is visible here. The inflammation improvement tells the more reliable story. |
Honest analysis
What changed, what didn't,
and what surprised me
The headline: inflammation dropped 69%
My hs-CRP went from 6.4 to 2.0 mg/L in 30 days. That's the single most significant biological change in the entire experiment. High-sensitivity CRP is one of the most reliable markers of systemic inflammation — and mine started in the "higher relative cardiovascular risk" range. After 30 days of daily floating it dropped to the average range. That is a meaningful, measurable change in how my body is managing inflammatory load.
The nervous system responded clearly
HRV improved 33%, readiness scores climbed, stress minutes dropped, and restorative minutes increased by 43% — during a week when I was working more than the previous months combined. The signal is clear: my nervous system was handling load better. Not because life got easier, but because my baseline recovery capacity improved.
The cardiovascular picture is better than the raw numbers suggest
Total cholesterol and LDL ticked up slightly between draws — but context matters. HDL jumped significantly (60→71), and both key ratios — Chol/HDL and LDL/HDL — actually improved. The ratios are what cardiovascular researchers care about, and mine moved in the right direction.
The Seattle week shows up in the data — and that's a good thing
Biological age ticked up and the Superpower overall score dipped slightly. This coincides exactly with the week I walked 8+ miles a day, slept poorly, crossed time zones, and dismantled a float tank solo after a red-eye flight. That stress signature in the data actually adds credibility to the experiment — it shows the tracking works. Importantly, my readiness and HRV bounced back within 48 hours of returning to my normal routine and daily floating. That recovery speed was notable.
What floating probably didn't fix
The cardiovascular markers that were elevated going in (LDL, cholesterol) are diet and genetics, not something 30 days of any single practice will resolve. I already knew about the burgers and beer.
The bottom line is this: 30 days of daily floating produced measurable, significant changes in inflammation and nervous system regulation. The data didn't show everything improving everywhere — but the markers most directly connected to what floating is supposed to do moved exactly the way you'd expect. That's the honest answer.
The full record
30 days, one float at a time
Scroll through each day — Oura data, float notes, and what I noticed.
30-Day Float Challenge
Daily Oura ring results & notes from each float
Every day of the challenge is here — readiness, HRV, sleep, stress minutes, and what I noticed in and out of the tank. Swipe or scroll to move through the days.
Feb 9 – Mar 10, 2026 · 30 floats in 31 days
Week one
Feb 9–15
The sedentary baseline. Working 40–45 hours/week in-shop. First signs of nervous system change appear by day 4.
Day 1 · Feb 9 · 45 min
First day of the challenge. Had my blood drawn — couldn't drink the night before which was painful given it was Super Bowl Sunday. Had great ideas in the tank but they dissipated before I got out.
Day 2 · Feb 10 · 90 min
Slept late. I cut caffeine and alcohol significantly back in November — used to go to bed by 10, now more sporadic, but I wake up much more easily. Felt very rested this morning.
Day 3 · Feb 11 · 60 min
Probably the best float I have ever had. I could see the aura from my body, and everything was calm. Writing this 2 hours later and I still have this overwhelming sensation of calm. Things that didn't go my way today — it doesn't matter.
Day 4 · Feb 12 · 45 min
I haven't felt the need for background noise. Usually need podcasts in the car, TV in the background. Yesterday into this morning — I didn't. I also feel like the world is slowing down around me.
Day 5 · Feb 13 · 60 min · 7am
Early morning float — I cannot suggest it enough. Traffic less annoying. Task list not stressing me out. Life is moving at an absurdly slow pace, almost like I'm on an island somewhere.
Day 6 · Feb 14 · 60 min · 7am
In the first 15 minutes my brain created 3D images of my problems and put them together like a puzzle. Solved one of my most persistent Float Boston issues. Then there was purple — shapes, faces, things I couldn't recognize. My body was encapsulated in a purple hue. Sat in the massage chair in the dark for 20 minutes processing it.
Week 1 Summary · Feb 15
HRV up 25%. Readiness up 13%. Stress minutes dropped from 76/day to 52. Two days with zero stress. Nothing in my life slowed down — I'm still running a business. The difference isn't that stress disappeared. It's that my body is responding to it differently.
Week two
Feb 16–22
Working more than previous months. Restorative minutes up 43% from pre-challenge average. The data asks: how can I be more restored while doing more work?
Day 8 · Feb 16 · 90 min
No notes today.
Day 9 · Feb 17 · 60 min
The floater's high: first quarter the mind races with everything. Then a switch flips — one moment you're wondering what's for dinner, the next, nothing. Complete quiet. Time has no meaning. When the alarm went off I wanted to stay and triple the time.
Day 10 · Feb 18 · 60 min
Colors and lights from the tank are appearing outside the tank for 10 minutes after I float. Haven't yelled at a Masshole driver in days. Reading more, watching TV less. HRV one of the highest since I started.
Day 11 · Feb 19 · 60 min
One thing to report: I was "calm" for over 4 hours yesterday — well above my average — and I was here at Float for over 12 hours.
Day 12 · Feb 20 · 60 min
One of my worst sleep scores in ages. Floating after a bad night was perfect — didn't nap in the tank, but came out completely rejuvenated. Maybe floating restores you after a bad night's sleep too?
Day 13 · Feb 21 · 60 min
Focused on where your body ends and the water begins — you can't tell. Instead of lights and colors, I had the sensation of floating in the vastness of space. A completely unique experience.
Week 2 Summary · Feb 22
Restorative minutes up 43% from pre-challenge average — during a week where I worked more than any previous month. Three days over 200 restorative minutes. If you ask me right now: does floating measurably help? 100% yes.
Week three · The disruption
Feb 23 – Mar 1
Seattle. 8+ miles/day walking, jet lag, alcohol, a red-eye, and solo tank dismantling. The experiment gets stress-tested. Watch the data react.
Day 15–16 · Feb 23
Slept at Float after the last client — scored 89 on sleep but woke up with a wrecked back. Short float the next morning after panicking mid-session about an operations issue. Turned out it was due next week.
Day 19 · Feb 26 · 4am
Missed a day — ad issue crashed sales, spent 18 hours fixing it. Chose food over floating at 11pm. The 4am pre-flight float was the best of the entire challenge. Came out feeling perfect. The data tells a different story: lowest scores all year.
Day 20 · Feb 27
HRV doubled overnight. That is not normal. Whatever happened — I recovered perfectly. Hyper focused, energy back to full. The bounce-back feels remarkable.
Week 3 Summary · Mar 1
Active calories nearly tripled vs weeks 1–2. Readiness and HRV dropped hard. But this is the real test — how fast does floating bring you back from being wrecked? Tune in next week.
Week four · The recovery
Mar 2–10
Back in Somerville. Work hours jumped to 80/week. Body wrecked from travel. The question: how fast does daily floating help you come back?
Day 22 · Mar 2
Last day of craziness. Walked 8 miles, found a self-pour wine bar (dangerous), took a red-eye, slept 4 hours, dismantled a float tank solo. A 4-person job. My body is screaming. Tomorrow the recovery begins.
Day 24 · Mar 4
Recovery complete. All scores back within range 48 hours after the craziness ended. One notable thing: I got into the deep float phase in just 5 minutes — a new record. My brain knows the shortcut now.
Day 27 · Mar 7
Needed this float. Back to 80-hour work weeks. Body and mind taking hits. Even though the scores aren't the greatest, I don't feel as terrible as I look on paper. If you've ever worked an 80-hour week — you gotta float.
Day 29 · Mar 9
Day 29 — tomorrow is the last day. Blood draw is scheduled Thursday. Everyone following along, thank you.
Day 30 · Mar 10 · Final day
30 floats in 31 days. Steadier, clearer, less reactive than when I started. The floater's high takes 5 minutes now instead of 20. I don't need background noise to feel okay. And I bounced back from dismantling a float tank solo in 48 hours. I'll take that.
← swipe or scroll to move through the days →
Do it yourself
Want to run your own
30-day float challenge?
We offer the challenge to Float Boston clients — 30 floats for $650 ($21/float), with a limit of 10 active participants at a time to keep the tanks accessible for regular clients.
Use our referral link to get $50 off Superpower bio-marker testing if you want to track your own blood markers before and after.
Complete the challenge
30 floats in 90 days — because even I found 30 in 30 hard, and I'm here almost every day. Complete it and choose your reward: $50 floats for one year, or a 2-float/month membership for $75.
Post a testimonial
Post a video testimonial after completing the challenge and get a $100 gift certificate. Your story helps others find floating.
Track your biology
Use Superpower for comprehensive blood testing before and after. $50 off with our link.
The fine print
Maximum 10 active challenges at once. Spots open as participants complete or discontinue. Ask us about current availability.
Stay in the loop. Experiment updates, challenge openings, and float tips in your inbox.
Sign me up